
The All Campaign Placements view gives you a consolidated, high-level look at how your Amazon ads perform across Top of Search, Product Pages, and Rest of Search—all in one place.
Instead of checking placements campaign by campaign, this dashboard helps you quickly understand where your spend, impressions, and sales are really coming from, so you can make faster and more confident optimization decisions.
With All Campaign Placements, you can:
View performance across all campaigns and placements in one table
Compare results between Top of Search, Product Pages, and Rest of Search
Identify which placements deserve more budget or bid adjustments
Spot underperforming placements before they waste spend
📍 How to Access All Campaign Placements
Click Ad Manager in the left-hand menu.
Select View All Placements.
You’ll land on the All Placements dashboard, showing placement-level performance across your selected date range.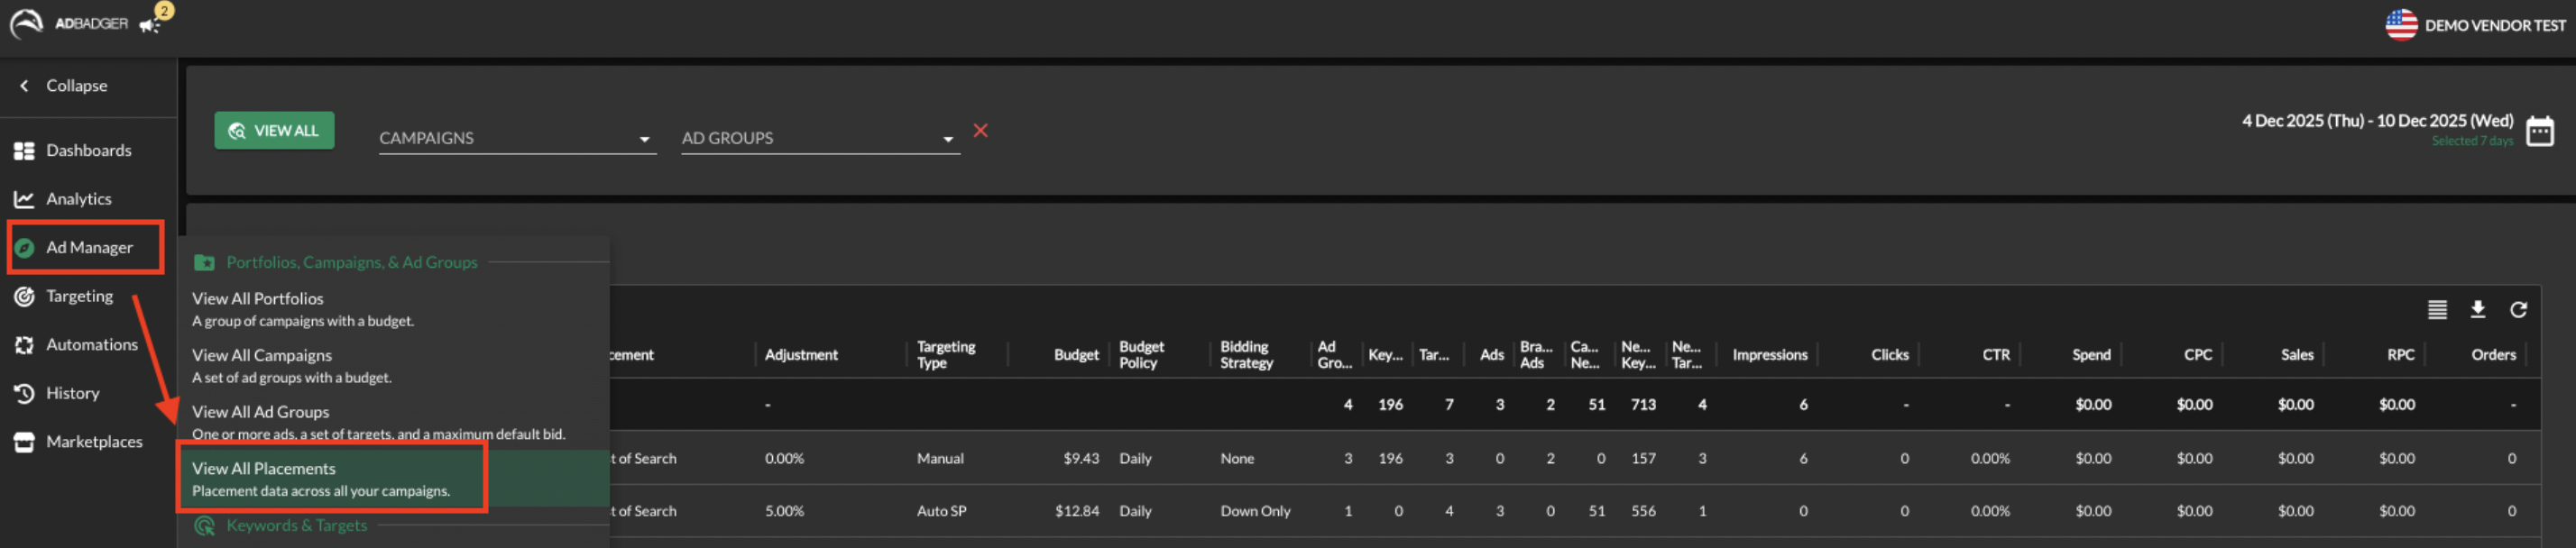
How It Works
Data is aggregated across all eligible campaigns
Each row represents a campaign + placement combination
Metrics include impressions, clicks, spend, CPC, sales, orders, CVR, ACOS, and ROAS
Use the date selector to analyze trends over specific time periods
Understanding the Placement Categories
Amazon divides your ad traffic into three distinct buckets, all of which are tracked in this view:
Top of Search (First Page): Sponsored Brands and Sponsored Products ads that appear on the very first page of search results. This usually has the highest CTR and CPC.
Product Pages: Ads that appear on product detail pages (where your competitors’ products live) and other "off-search" placements like the add-to-cart page.
Rest of Search: Ads that appear in the middle or at the bottom of search results, as well as on the second page of results and beyond.
💡 Tips for Best Use
1️⃣ Start With the Big Picture
See which placements drive results overall
Identify clear winners and losers before drilling down
This helps you avoid optimizing in silos.
2️⃣ Compare Placements, Not Just Campaigns
A campaign may look fine overall—but placements often tell a different story.
Strong Top of Search, weak Product Pages → shift bids
High spend, low sales in Rest of Search → consider lowering placement adjustments
Placement-level insights lead to cleaner optimizations.
3️⃣ Use It to Guide Budget Reallocation
Look for:
High ROAS or low ACOS placements → scale confidently
High spend with no sales → reduce exposure
This dashboard makes it easier to move budget where it actually performs.
4️⃣ Pair With Placement Adjustments
After identifying trends:
Adjust placement modifiers at the campaign level
Re-check performance after changes using the same view
This closes the loop between insight → action → validation.
5️⃣ Monitor After Major Changes
Review All Campaign Placements after:
Bid strategy updates
Budget increases or cuts
Seasonal pushes or promotions
It helps confirm whether changes improved placement efficiency.
🚀 Why All Campaign Placements Matters
Placement performance often explains why a campaign succeeds or fails.
This view helps you:
See the full landscape, not just isolated metrics
Make smarter allocation decisions faster
Optimize with confidence instead of guesswork
It’s another way Ad Badger helps you see both the forest and the trees.
Need Help?
💬 Reach out to our Support Team anytime via the Live Chat bubble in the lower-right corner of the app.