
Ad Badger's Advertising Trends Report includes an abundance of information relating to your marketplace's advertising metrics. Use this report to view data with time-over-time comparisons.
This report is divided into two tabs to increase maximum efficiency:
- the Snapshot
- the Breakdown.
In this article, we'll look at each section of the report and explore why it is so awesome at helping you break down changes in your Amazon PPC performance.
The Snapshot Tab
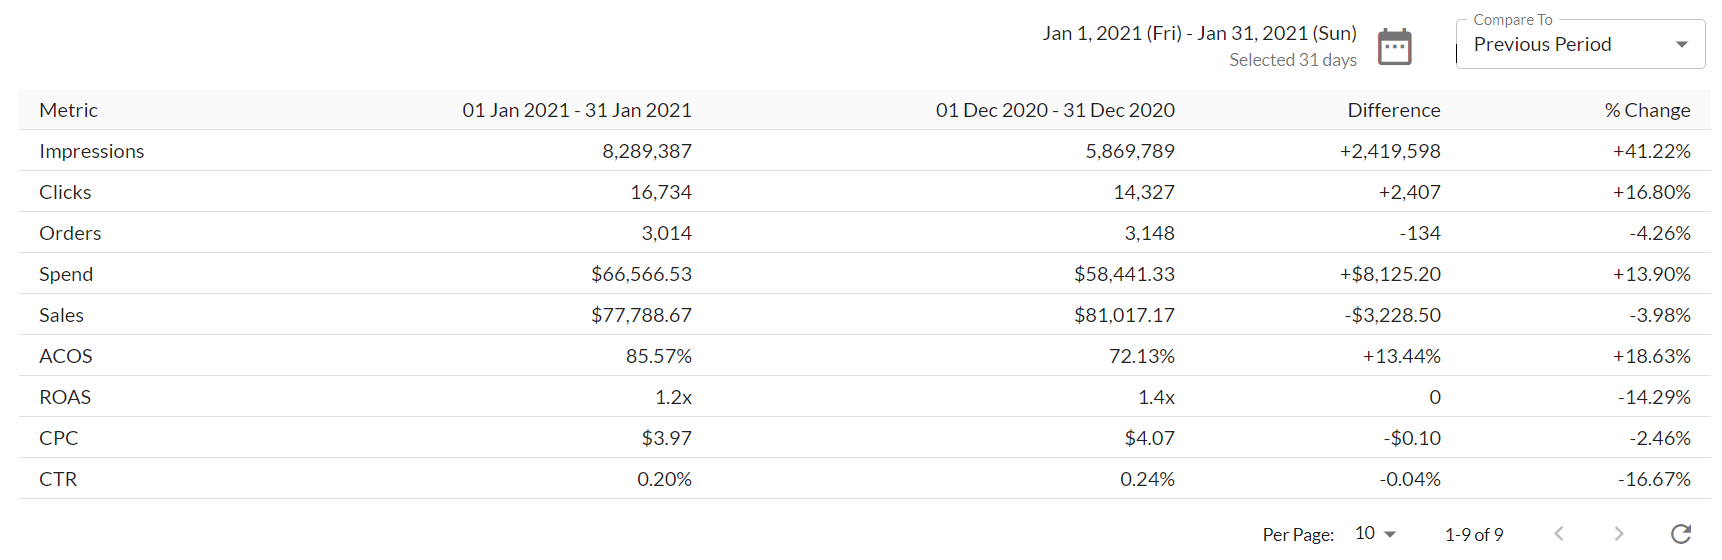
Time Comparison Table
This pivot table displays the metrics for your Marketplace summarized by a period of time. There are four columns in this table, specifically:
- Selected Time Period
- Comparison Time Period
- Difference (or delta ∆)
- Percent (%) Change
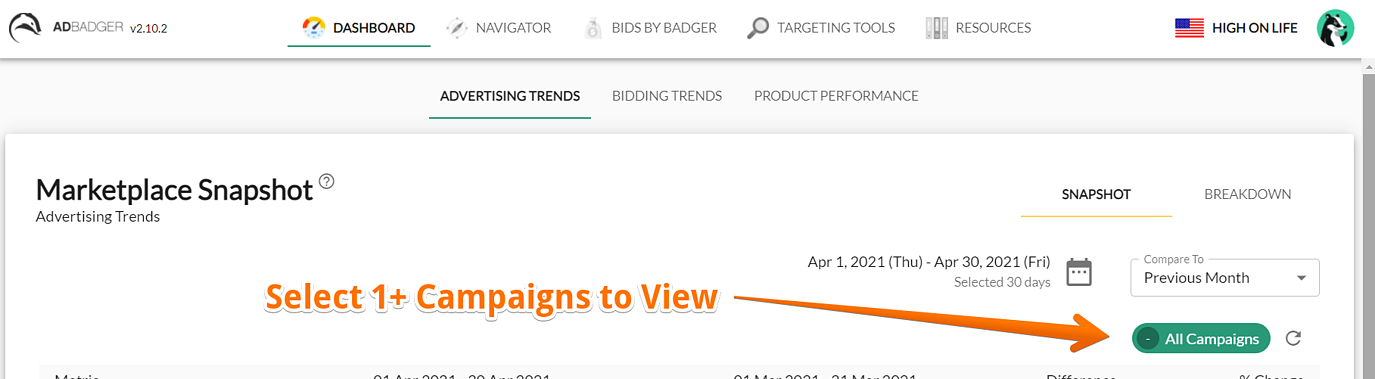
You can always change the selected time period or the comparison period using the controls located at the top right of the table.
Coming Soon: A customizable comparison period. When ready, this will essentially be a form of two date pickers. This will allow you to view any two specific periods of time.
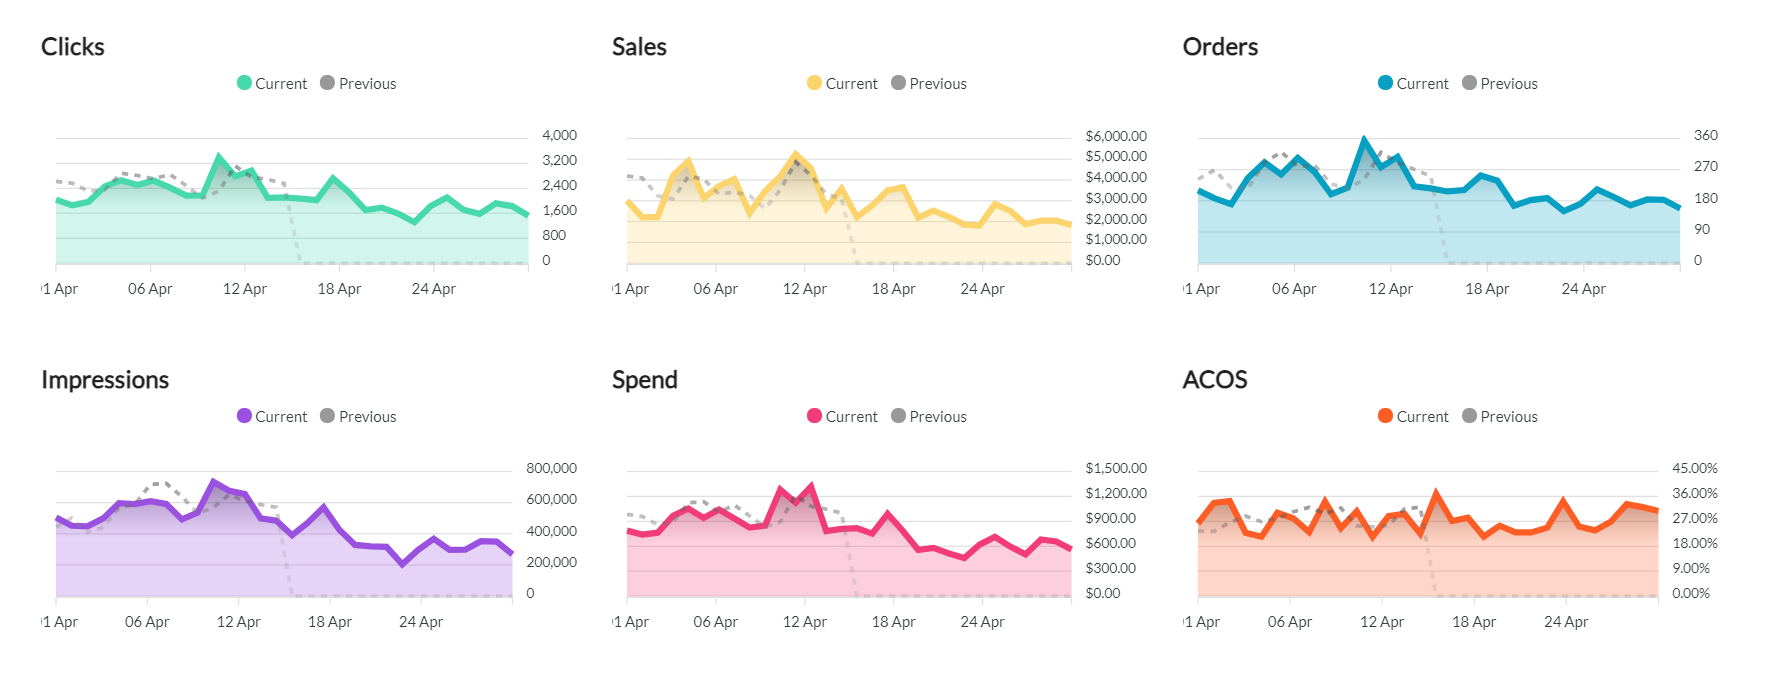
Metric Trend Charts
Underneath the time comparison table, view a small chart for each of your metrics. These charts shift with the Selected Time Frame from above. The dashed line shows your comparison data versus your Selected Time Frame.
We just enjoy giving you a beautiful way to view each individual metric's trend.
Coming Soon: The ability to view the Comparison Time Frame data within these charts along with the originally selected time frame's data
The Breakdown Tab
Breakdown Table
In the Breakdown Table, you can view your marketplace's metric data time-over-time.
Currently, there are two options for viewing your data:
- By Month
- By Week
Note: Adjusting the time-over-time selection will affect the above chart as well.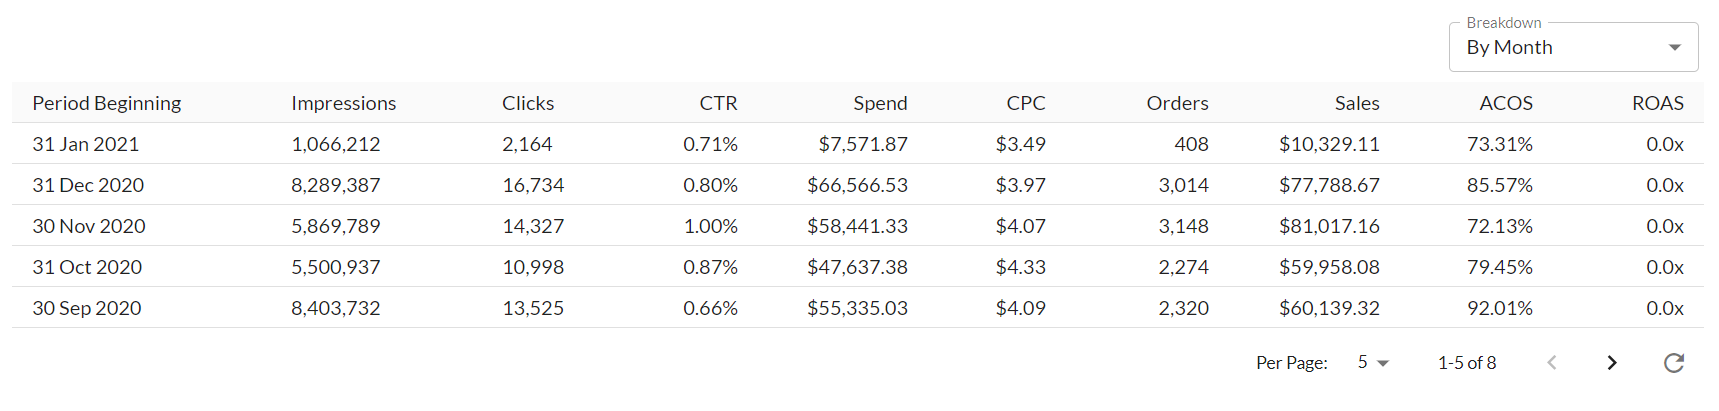
Breakdown Column Chart
The data in this chart matches the data appearing in the Breakdown Table. This provides easy visualization for how your metrics are trending in comparison to each other.
You can adjust which metrics are showing in the chart by using the metric selector located in the top left of the chart.
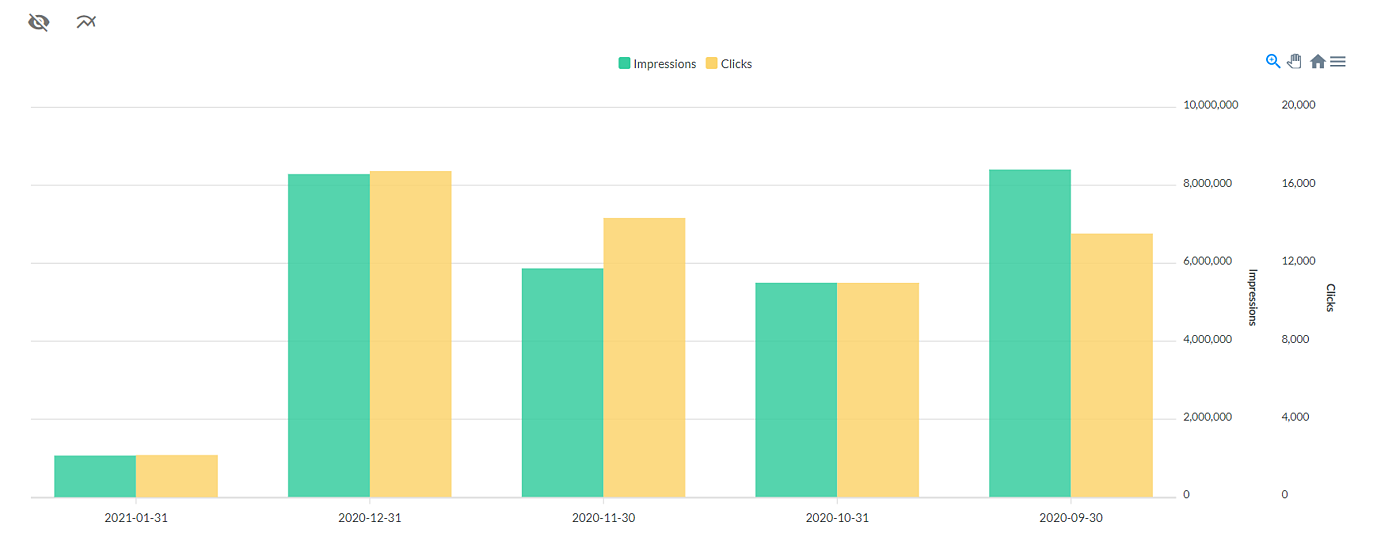
Ad Badger Pro-Tip: If you do not care for this chart, you can hide it using the 'eye' icon located in the top left.
Another Ad Badger Pro-Tip: To filter the data in either tab even further, use the adjusted SuperSearch tool to select a specific portfolio or ad campaign that you wish to view.
 Questions?