
The Profits Dashboard is a powerful tool designed to give you a clear, comprehensive view of your Amazon business’s financial health. By aggregating data across sales, returns, Amazon fees, and PPC spend, it allows you to move beyond simple "Sales" metrics and understand your true SKU economics.
Accessing the Profits Dashboard
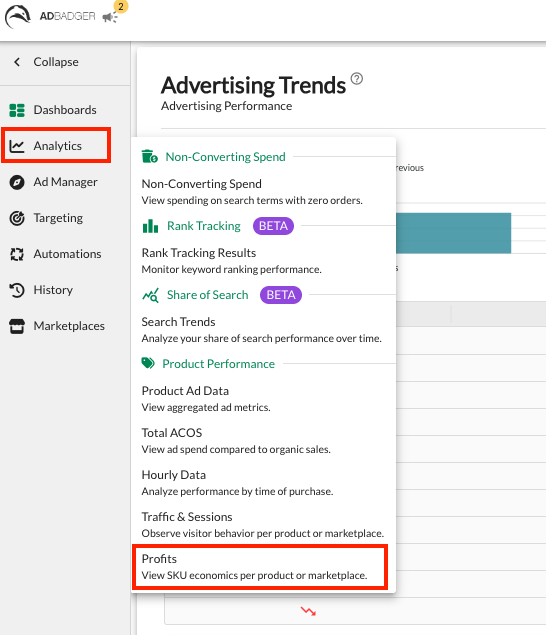
Navigate to the Analytics tab in the left-hand sidebar.
Select Profits from the dropdown menu.
Key Features & Insights
The Profits tool provides a granular breakdown of your performance by factoring in all business costs to help you make data-driven decisions.
1. High-Level Performance Trends
At the top of the dashboard, a visual bar chart compares your Total Sales against your Net Profit Total. This allows you to quickly spot trends in your margins over time and see if your profit is scaling alongside your revenue.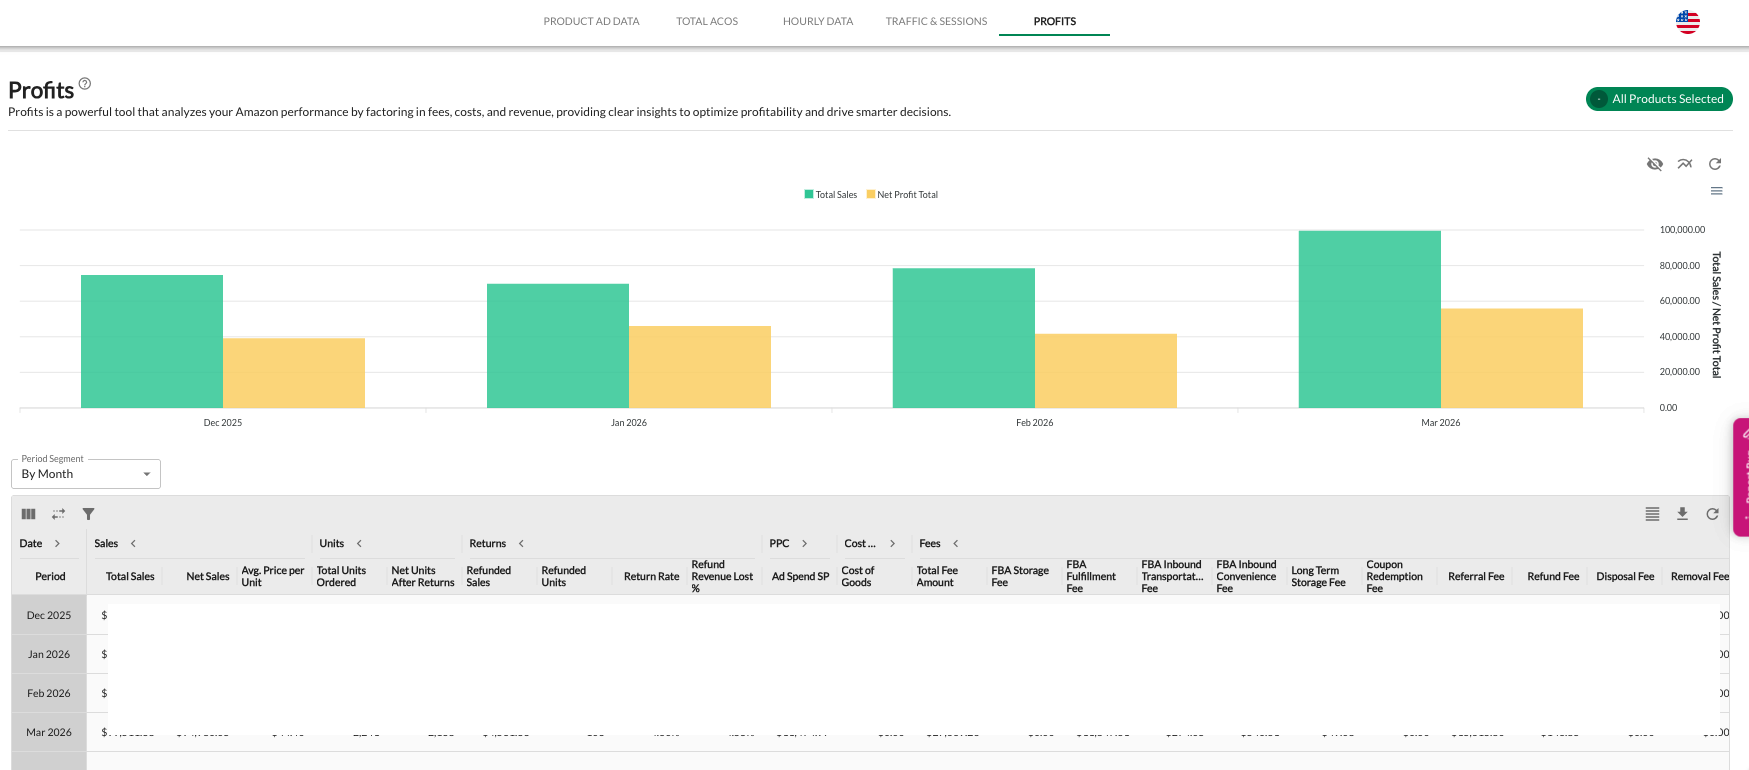
2. Comprehensive Data Breakdown
The data table organizes your metrics into logical groups. You can expand or collapse these categories using the Column Visibility settings to customize your view:
| Group | Key Metrics Included |
| Sales | Total Sales, Net Sales, Avg. Price per Unit |
| Units | Total Units Ordered, Net Units After Returns |
| Returns | Refunded Sales, Refunded Units, Return Rate % |
| PPC | Ad Spend SP (Sponsored Products only) |
| Cost of Goods Sold | Pulls directly from your Amazon settings |
| Fees | Total Fee Amount + 13 individual Amazon fee types |
| Profit | Net Profit Total, Cost per Unit, Gross Profit |
3. Understanding the Fee Breakdown
The Fees group is the most robust section of the dashboard, pulling every possible Amazon expense into one view. This includes:
Fulfillment & Storage: FBA Fulfillment, Storage, and Long Term Storage Fees.
Logistics: Inbound Transportation and Convenience Fees.
Transactional: Referral, Refund, and Coupon Redemption Fees.
Inventory & Promotions: Disposal, Removal, Customer Return, and Lightning Deal Fees.
Important Data Notes
PPC Coverage: The PPC column currently reflects Ad Spend SP (Sponsored Products). Other ad types (like Sponsored Brands or Display) are not included in this specific dashboard at this time.
COGS Source: Cost of Goods Sold (COGS) data is pulled directly from Amazon. If you have not provided this information within your Amazon Seller Central account, it will not populate here.
Customizing Your View
Toggle Time Aggregation
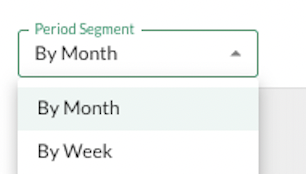
You can analyze your profitability at different levels of granularity depending on your needs. Use the Period Segment dropdown located above the data table to switch between:
By Month: Best for long-term strategic planning and monthly bookkeeping.
By Week: Best for monitoring the immediate impact of price changes or new ad campaigns.
Manage Column Visibility
If the table feels too crowded, use the Column Visibility tool (the column icon above the table) to search for specific metrics or hide entire groups like "Fees" to focus only on Sales and Profit.
Filter by Product or Marketplace
Use the Global Filter (top right) to view data for all products or drill down into specific SKUs and marketplaces for a more targeted economic analysis.
Why Use the Profits Dashboard?
Identify "Profit Bleed": Spot products with high return rates or excessive FBA fees that are eating into your margins.
Validate Ad Spend: Ensure that your PPC investment is actually leading to bottom-line growth, not just "vanity" sales.
Real-Time Economics: Avoid waiting for your monthly accounting reports; see your success in real-time and make data-driven decisions with ease.
💬 Need Help?
Reach out to our Support Team anytime through the Live Chat bubble in the lower-right corner of the tool.