The Bids by Badger Dashboard!
Ad Badger's new Bidding Dashboard includes a wealth of information all related to your marketplace's account health.
This new dashboard is divided into two sections to increase maximum efficiency: Bidding Performance and a Bid Health Report Card.
In this article, we'll look at each section of the dashboard and explore what makes it so powerful.
Scroll to the bottom for a video walkthrough from Ad Badger Founder, Michael Erickson Facchin.
The Bidding Performance Tab
Bids Optimized
These first three numbers are the total number of bids that were optimized in your marketplace within the last 24 hours.
Specifically:
Overall Total Number of Bids Optimized
Total Number of Bids That Increased
Total Number of Bids That Decreased

Coming Soon: Our team is hard at work on a detailed form of Bid Change History. Once this feature is up and running, you will be able to view a detailed list of exactly which bids were changed.
Keyword and Target Improvements
The next set of metrics in the Performance Tab is a quick view of your Keyword and Target Improvements within the last 30 days.
Specifically:
Keywords and Targets with an ACOS Improvement
Keywords and Targets with More Sales
Keywords and Targets with More Clicks

Ad Badger Pro Tip: The first five (5) keywords and/ or targets of these totals are what you will view in the Top 5 Most Improved table below.
Top 5 Most Improved
This table shows you a detailed list of the top five most improved keywords and/ or targets split up by improvements in ACOS, sales, and number of clicks.

You can view each category by selecting the tabs labeled By ACOS, By Sales, and By Clicks at the top of the table.
Ad Badger Pro Tip: If you would like to view even more details about a particular keyword or target, click on the "View" icon in the Actions column. This will direct you to view that keyword within Bids by Badger, where you can then see all of its additional metrics.
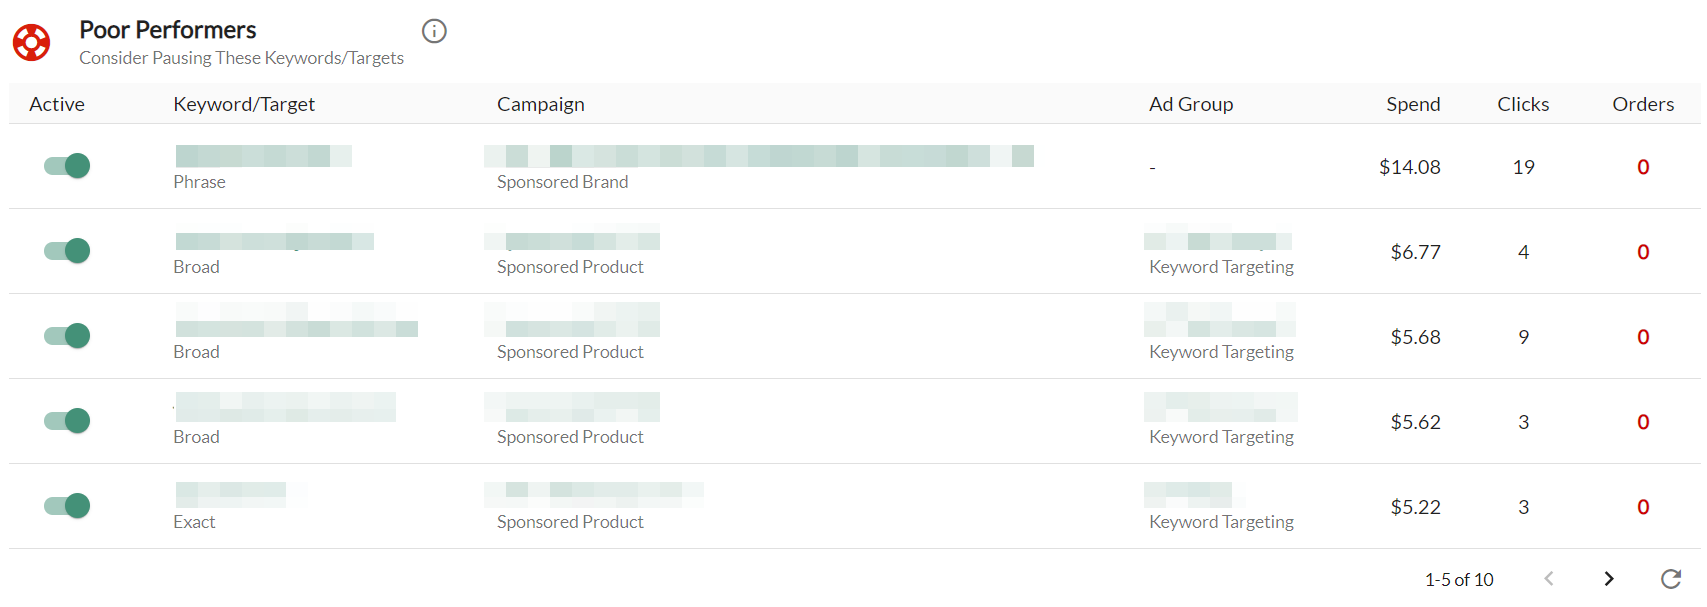
Poor Performers
This table shows you a detailed list of your marketplace's poorest performing keywords and/ or targets. These poor performers are listed using the past 30 days of data. These include all keywords and targets which have spend, no orders, are enabled and CURRENTLY delivering.
Note: To get the latest delivering status perform a campaign sync and then return the the poor performers dashboard.
We recommend that you consider pausing the keywords and/ or targets in this list to improve your overall bidding health. If you see a keyword and/ or target in this list that you would like to pause, you can do so right from this table with the Active Column toggle.

Ad Badger Pro Tip: If you would like to view even more details about a particular keyword or target before pausing it, click on the "View" icon in the Actions column. This will direct you to view that keyword within Bids by Badger, where you can then see all of its additional metrics. You do not even have to go back to the Dashboard-- you can pause the keyword (and any additional poor-performing keywords in the same campaign/ad group) right from this screen!
The Bid Health Report Card Tab
Bid Health Index
The first thing you see on your Bidding Report Card is a grade. This overall grade comes from a weighted average of each of the other categories. These categories measure factors that influence how easy or difficult it will be to achieve your Target ACOS.
The best part about the Bid Health Report Card is that The Badger will give you suggestions for actions to take within your marketplace based on each individual score.
Average Ad Group Size
This number simply shows you the average number of keywords and/ or targets per ad group in your marketplace.
Ad Badger generally sees the best results from ad groups that have less than 35 keywords. If you have, on average, more than 35 keywords in your ad groups, we recommend either creating new ad groups or using the Poor Performers table on the Performance Tab to pause weak keywords.
ACOS Power Ratio
The ACOS Power Ratio is a new Ad Badger metric. This is the ratio of your overall marketplace ACOS compared to the ACOS of search terms with at least one order. A higher number means that your marketplace has too much broad, phrase, and/or automatic targeting.
Check out the exact ratio scale below:
Score | What It Means |
1.0 - 1.5 | The marketplace is too conservative with a Power Ratio of under 1.5. Most likely, this could indicate an over-reliance on branded searches and not enough testing to find new keywords. Use the positive keyword tool to identify new growth opportunities. Try to test a small amount of broad & phrase keywords. |
1.5 - 2.0 | This is the ACOS Power Golden Ratio! Congratulations, the PPC Ratio is exactly where it should be, between 1.5 and 2.0. You have a healthy combination of consistent winning searches that will bring in sales and a good ratio of experimental searches that are being tested to identify growth opportunities. |
2.0 - 2.5 | The marketplace may be too aggressive with a ratio between 2.0-2.5. There are too many searches getting clicks that are not driving conversions. This is likely due to excessive use of "Research" targeting, like automatic targeting, broad, phrase, or categories. Use the Search Term Quick Attack to reduce your testing or pause keywords. |
2.5 or higher | The marketplace is very aggressive with too many clicks coming from searches that never converted. Your ACOS could quickly be improved by using the Poor Performers tool in the Bidding Dashboard to pause keywords and using the negative keyword tool. |
Low Converting Keywords and Targets
This is the percentage of low data confidence keywords and/ or targets within your marketplace.
These low confidence keywords and/ or targets typically have only one or fewer orders per month. The ideal range to stay within for this metric is less than 20%. If you have a high percentage of these keywords and/or targets, then consider using the Poor Performers table in the Performance tab to improve your ACOS.
High Converting Keywords and Targets
This is the percentage of high data confidence keywords and/ or targets within your marketplace.
These high confidence keywords and/ or targets typically generate several orders per month. The ideal range to stay within for this metric is over 40%. If you have a low percentage of these keywords and/ or targets, then be sure to monitor the Poor Performers table in the Performance tab when you are testing new keywords in your marketplace. This will help you be sure that you are catching the weakest keywords and maintaining control of your ACOS.
Low-Efficiency Spending
This is the percentage of your ad spend that is going towards low data confidence keywords and/ or targets.
The ideal range to stay within for this metric is under 20%. If you have a high percentage of this ad spend, then consider using the Poor Performers table in the Performance tab to improve your ACOS.
High-Efficiency Spending
This is the percentage of your ad spend that is going towards high data confidence keywords and/ or targets.
The ideal range to stay within for this metric is over 40%. If you have a low percentage of this ad spend, then consider using the Poor Performers table in the Performance tab to improve your ACOS. This way you can be sure that you are spending your hard-earned money on your best and most reliable keywords and/or targets.
Hear It from Mike Himself
Check out the video below for a full and in-depth walkthrough of the Bids by Badger Dashboard and the power that it gives our users.
Questions?
Now that you know everything there is to know about the Bids by Badger Dashboard, get out there and start optimizing!

